
M5Stack은 ESP32기반의 디바이스이며, AskSensors는 IoT 디바이스로 부터 데이터를 받아서 그래프 형태로 보여주는 IoT 플랫폼이다.
M5Stack
ESP32 기반의 개발툴로 가로 세로 5cm라서 M5Stack이라고 이름이 붙여졌다고 한다.
AskSensors
AskSensors is an IoT platform designed to be the easiest application on the market, allowing users to connect, visualize and analyze their sensors data over the cloud. In this tutorial, we’ll be learning the basics you need to get started with askSensors, starting from creating account to visualizing data in graphs.
M5Stack으로 AskSensors에 데이터 보내기
M5Stack에 DHT12센서를 연결하여 온도, 습도 정보를, AskSensors에 연결해서 데이터를 그래프로 보는 형태의 구성은 다음과 같은 형태로 진행을 한다.
AskSensors 설정
설정은 간단하다. 서비스에 가입을 하고 새로운 센서(New Sensor를 클릭)를 만든후 모듈을 생성(모듈 탭에서 Add 버튼 클릭)한다. 여기서 모듈은 하나의 센서의 값을 받는 단위라고 생각하면 된다. 그러면 API 키가 생성이 되면 이 API 키의 end point에 데이터를 쓰면 된다.

모듈1에 10이라는 값을 쓴다면 다음과 같이 데이터를 보내면 된다.
https://asksensors.com/api.asksensors/write/MTWN7AQOLWJNEIF8RGMAW5EGKQFAHN2K?module1=10
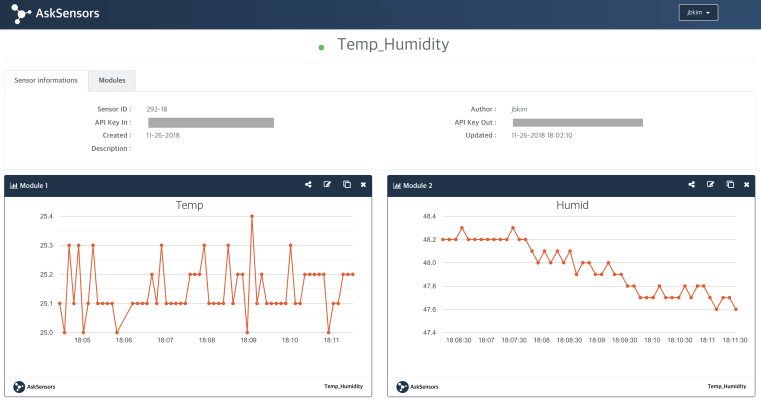
Data Visualization
“Show graph”를 클릭하면 데이터를 그래프로 볼 수 있다.

실제 데이터
테스트를 해보니 AskSensors는 ThingSpeak와 거의 같은 서비스인데 아직 베타버전. 아래 그림은 같은 데이터를 ThingSpeak에서 본 그래프이다.

참고